Visualizations for Digital Libraries
Gang Wan
ABSTRACT: Digital libraries have been
developed for over 20 years. However, it is still a concept vague to most of
us. The author provides quite a few examples in the article to illustrate how
information visualization techniques and applications, such as Digital Library
Visualizer, Fluid Treemap Interface, ActiveGraph, 3-D Vase Museum, Collaborative
Visual Interfaces, and AquaBrowser, could be integrated into digital
libraries to help users perceive information better and assist librarians in
managing digital collections.
1. Introduction
Having been developed
for over 20 years, “digital libraries” is no longer a concept just for library
and information professionals, but familiar to the public in general. Today,
even school children are able to find out information for their homework from
the Public Library of Science, a digital
library initiative created to provide scientific information to the general
public.
Although we have seen terms like “digital libraries”, “electronic libraries”, and “virtual libraries” quite often, the idea of digital libraries still remains vague to most of us. Based on several researchers’ works, digital libraries have a set of characteristics. First of all, digital libraries are the digital face of traditional libraries that include both digital collections and traditional, fixed media collections. So they encompass both electronic and paper materials. Secondly, they also contain digital materials that exist outside the physical and administrative boundaries of any libraries. Thirdly, they encompass all the processing and services that are the backbone and nerve system of libraries. Fourthly, digital libraries ideally provide a coherent view of all of the information provided by a library, regardless of its form or format. Last but not the least, digital libraries serve particular communities or constituencies, as traditional libraries do, though those communities may be widely dispersed throughout the network. (Arms, 1995; Graham, 1995; Chepesuik, 1997; Lynch and Garcia-Molina, 1995)
With these characteristics, digital libraries are content-rich, multimedia, and multilingual collections of documents that are distributed and accessible worldwide. As they are becoming the most important repository of mankind’s knowledge, the design of user-friendly interfaces to access, understand, and manage digital library content has become an active and challenging field of study. (Fox and Urs 2002) The rapid growth of digital libraries makes it necessary for librarians and information professionals to manage and organize the large amount of electronic information efficiently and effectively. (Borner and Chen 2002)
Since information visualization is the use of computer-supported, interactive, visual representations of abstract data to amplify cognition (Card et al. 1999), it can be integrated into digital libraries seamlessly to help users perceive information as well as help librarians manage information.
2. User tasks and Information Visualization
Understanding user tasks is the foundation of designing useful visualizations. Among the earliest researchers who attempted to apply information visualizations to digital libraries, Rao et al. (1996) defined several specific user tasks and illustrated some existing techniques that can be used to accomplish these tasks, such as TileBar, Cone Tree and Document Lens. As stated by them, these tasks were to browse subsets of source iteratively, view context of query match, visualize passages within documents, render sources and results, reflect time costs of interaction, manage multiple search processes, integrate multiple search and browse techniques, and visualize large information sets.
Another generalized description of these user tasks was brought forth by Zaphiris et al., (2004) later. They described three essential tasks in digital libraries: searching, navigation, and browsing.
In the last 10 years, computer scientists and information professionals have developed quite a few information visualization techniques for these three general tasks. In terms of searching, Shniederman et al. (1999) proposed the use of a two-dimensional display with continuous variables to view several thousands search results at once. They have used two strategies for this type of visualization: two-dimensional visualizations and browsers for hierarchical data sets, which were implemented by using categorical and hierarchical axes. In combination with a grid display, this type of visualization allows users to see an overview by color-coded dots or bar charts arranged in a grid and organized by familiarly labeled categories. They can probe further by zooming in on desired categories or switching to another hierarchical variable. Another project completed by Liu et al. (1998), a language-independent document classification system, can provide search aid in a digital library environment and help users analyze the search query results visually. This system uses a vector model to calculate the similarities between documents and a Java applet to display the classification to the user.
In terms of navigation, there are a variety of information visualization applications. The previous example of two-dimensional display advocated by Shniederman et al. (1999) contained navigation functions. Another example is Hascoet’s (1998) map interface applied to a digital library. This prototype is associated with summary views in the form of navigation trees and neighbor trees showing related documents to one focus document. The user interface is composed of maps automatically generated based on the characteristics of the documents retrieved and a default configuration. Users can modify the configuration of maps and edit maps, performing such classical operations as cut, paste, move, delete, save and load a view, expand a view etc.
As for browsing, a technique that has been employed for quite a while is the use of dynamic queries. An early example is Ahlberg and Shniederman’s (1994) FilmFinder. Users can move several sliders to select query parameters, and the search results will change with the movement of the sliders. This tool lets users browse movie records more easily and cognitively. Another technique is Query Previews proposed by Doan et al. (1996). Query Previews allows users to rapidly gain an understanding of the content and scope of a digital collection. Users are presented with generalized previews of the entire database using only the most salient attributes. When they select rough ranges, they will immediately learn the availability of the data for their proposed query.
All these earlier projects provide good examples and paradigms to some recent researches. The discussion of visualization techniques in the next section will be based on these three essential tasks.
3. Techniques and
applications
This section
presents several recent information visualization techniques or applications in
a digital library environment. All these applications have focused on the tasks
of searching, navigation and browsing. Many older applications mentioned
earlier are still very useful today and provide good foundations to these
recently developed applications. As both digital library and information
visualization are developing very fast, I will try to use more recent examples.
3.1.
LVis – Digital Library Visualizer
The
Two interfaces have been implemented for LVis. A 2-D Java applet was used on a desktop computer for details, and a 3-D immersive environment for the CAVE. CAVE (CAVE Automatic Virtual Environment) is a virtual reality 10'x10'x10' theater made up of three rear-projection screens for walls and a down-projection screen for the floor, and projectors throw full-color workstation fields (1280x512 stereo) at 120Hz onto the screens, giving between 2,000 and 4,000 linear pixel resolution to the surrounding composite image. (Cruz-Neira et al., 1993)
Both 2-D and 3-D interfaces give users access to three levels of details: they provide an overview about document clusters and their relations; they show how images in the same cluster relate to one another; and they give more detailed information about an image such as its description or its full size version.
In the CAVE environment, users can first enter a virtual
display theater that stages the digital library as a cyberspace
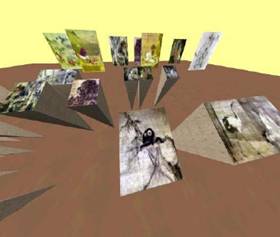
Fig. 1 LVis: Image Crystals and Panels
In this environment, each crystal represents a set of images with semantically similar image descriptions. Physical proximity here again is used as a metaphor to encode semantic similarities among images. The formations of the crystalline structures depend on the size of the actual search result data set. Navigation in this space is easy. Users can also “walk” through this environment and select images of interest to display in a larger and clearer version (as two images showed in Figure 1). If the larger version is not satisfying, it can be returned to its previous iconic presentation.
3.2.
UC System: A Fluid Treemap Interface for Digital Libraries
This system
was developed by Good et al. (2005) at
UC uses
continuous and quantum Treemap layouts to
present collections of documents. Continuous Treemaps are space-filling
visualizations of trees that assign area to tree nodes based on the weighting
of the nodes (Good et al., 2005). In continuous Treemaps, the aspect ratio of
the cells is not constrained even though square cells are often preferred.
Quantum Treemaps extend this idea by making cell dimensions an even multiple of
a unit size (Bederson et al., 2002). The
Treemap visualizations provide meaningful overviews of document collections and
fast, intuitive navigation between multiple documents in a working set.
An important
aspect of the interface is the fluidity of navigation. This allows the user to
focus on the documents rather than on interacting with the tool. As a zoomable
user interface, an object will zoom in when the user left clicks on it, and
will zoom out when the user clicks on the background. However, the combination
of a zoomable user interface and continuous Treemaps gives arise to a problem:
conflicts with aspect ratios. To solve this problem, Good et al. zoom and morph
the cell to the window size while leaving the rest of the layout in place. Thus
the visual disturbance of the display is minimized since only a single cell
moves.
In terms of
searching, this system provides several methods to filter results. Firstly, its
interface includes mechanism to search for specific content within the
documents. The system increasingly highlights matching documents as letters are
added to the search query to immediately indicate matching documents. Secondly,
the user can also choose to update the view to display only the documents that
match the current query. Figure 2 gives an example of a user initiated query
process.
In the
scenario described by Fig. 2, the user types search terms at first (2.1), and
interactive highlights appear for groups with matching documents (2.2). The
user presses a button to limit the view to only matching documents (2.3).
Finally, the user zooms in on a document and begins reading with an integrated
reading tool. (2.4)
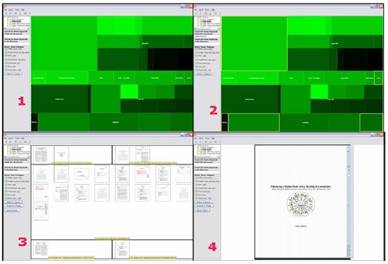
Fig. 2. The search interface of the UC
system.
The UC system
also offers a mechanism that allows the user to compare multiple documents
easily. After the user retrieves a set of document through a search, s/he can
press a button to “explode” the documents to pages. The user can continue
zooming in to a portion of a single document, and then select a document page
to read with the integrated reading tool.
In short, UC
system uses Treemaps as the primary visual metaphor and various visualization
techniques to enhance user interactions, such as zooming, interactively
highlighting, and exploding as a navigational metaphor.
3.3.
ActiveGraph
ActiveGraph
is an information visualization tool designed by Mark et al. (2000) at Los
Alamos National Laboratory. It aims to provide users a concise, customizable
view of documents in a digital library. In this system, a set of digital
library documents is represented as a data set in a 2-D or 3-D scatter plot.
The data set can represent any digital library objects in various formats
including books, journals, papers, images and Web resources.
Mark et al.
used six visual attributes of the scatter plot: the X-,
Y -, and Z-axes, color, size, and shape to encode the bibliographic information
of documents in a digital library, including title, author, date of
publication, and number of citations. The user can select and adjust these
attributes from a control panel on the right-hand side of the screen. Thus
ActiveGraph allows users to both view and customize the contents of a digital
library.
The main
visual representation of this tool is a scatter plot. Scatter plots have been
used to represent large sets of data for a long time. They provide an overview
of a data set and show the distribution of data points clearly, revealing
clusters and statistical information (Tufte, 1983). Hence they make it possible
for users to perceive meaningful patterns of the data.
An example of
using ActiveGraph scatter plot to visualize citation data for postdoctoral
researchers at Los Alamos National Laboratory (LANL) is given in Fig. 3. This
scatter plot intends to provide users with the information like how many times
their papers published between 1998 and 2002 were cited. The visualization is
based on the metadata in the LANL digital library.
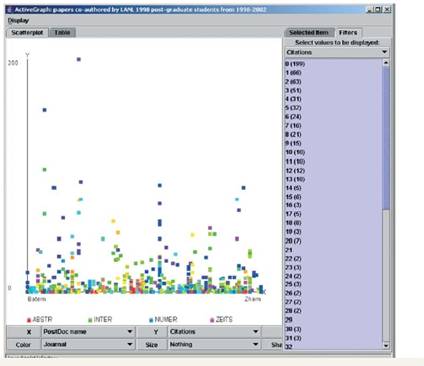
Fig. 3.
ActiveGraph scatter plot of citation data for papers authored by LANL postdocs
In this
scatter plot, the last name of a postdoctoral researcher is mapped to the
X-axis and the number of citations is mapped to the Y-axis. A pixel of a
particular color can provide two pieces of information, for example, by
encoding a paper and the subject category of the paper. A group of pixels of a
particular size, shape, and color can provide four pieces of information by
encoding a paper, the subject category of the paper, whether the paper has been
cited, and whether the paper has been read by another user of the collaborative
library. From this scatter plot, users can easily learn the citation pattern of
these papers.
Unlike some
other scatter plot applications such as HomeFinder and FilmFinder, ActiveGraph
uses different filters for queries. It uses filter lists instead of filter
sliders, which consist of selection list boxes, one for each data attribute.
These filter lists can provide users with functionality that is important in
the context of digital libraries. ActiveGraph allows users to manipulate the
display of data in another manner by applying a logarithmic transformation. As
some datasets like citation data frequently have an exponential distribution,
the logarithmic transformation can spread the clustered dots and make them more
evenly across the scatter plot.
Other data
transformations and visualizations may be important in some cases as well, such
as parallel coordinates for displaying citation statistics for the same group
of researchers at different points of time.
Although the
scatter plot is not a new visualization technique at all, this example
demonstrates that it can be used in a digital library environment effectively
and efficiently by encoding document attributes and designing proper filters.
3.4.
3-D
The previous
example, LVis, already introduced the applications of 3-D representations in
digital libraries. The 3-D Vase Museum developed
by Shiaw et al. (2004) at
In this 3-D Vase Museum, the user can navigate seamlessly from a high level scatter plot-like plan view to a perspective overview of a subset of the collection, to a view of an individual item, to retrieval of data associated with that item, all within the same virtual room and without any mode change or special command.
Unlike the traditional digital library which displays thumbnails and descriptions of vases in the main browser interface, this museum is a 3-D virtual environment that presents each vase as a 3-D object and places it in a 3-D space of a room within a museum. Fig. 4 gives a wide-angle view of this 3-D museum.
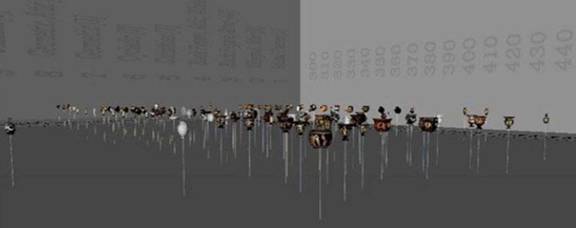
Fig. 4.
A wide-angle overview of the 3-D
In this view, one wall represents the timeline (year B.C.E.) and the adjacent wall represents the types of wares (e.g., red figures, black figures). The user can “walk” through this virtual room and look at the vases. The wide-angle view showed in Fig. 4 will then be transited to an eye-level view so that the user can probe the objects more clearly. When the user continues “walking” toward an object of interest, secondary information about this vase will appear in the virtual scene. If the user looks closer, the text information becomes clearer. As s/he moves farther and farther away, the information becomes less and less visible until it eventually disappears from the scene.
If the user clicks on the vase HTML page, a version of the
original HTML page will be loaded, from which a 3-D model of the vase could be
loaded. The user can then rotate this 3-D model on the screen using the mouse
to see all the aspects of the vase. The 3-D
The user can also navigate the room in a perspective view by switching the view port upward toward the ceiling (watching from upside). The user can then switch the views between a high-level scatter plot and a 3-D perspective view. In the previous section, an example of scatter plot has been introduced. Similarly, in this application, the X- and Y- axes are mapped to two attributes of the vases: year and ware. With this seamless blend from a high-level data plot to 3-D objects, the user can navigate without losing the point of view or context by just moving within the virtual environment.
According to Shiaw et al. (2004), they have done a usability
test. They designed some tasks based on archaeology courses and asked subjects
to perform them in the original traditional digital library and this 3-D
museum. The results showed that subjects who used the 3-D
3.5. Collaborative
Visual Interfaces to Digital Libraries
This example is an ongoing project led by Borner at
A Semantic Treemap algorithm (Feng & Borner, 2002) has been developed to layout documents in a 3-D space. Semantic Treemaps utilize the original Treemap approach to determine the size (dependent on the number of documents) and layout of document clusters. Subsequently, they applied an algorithm (force directed placement) to the documents in each cluster to place documents spatially based on their semantic similarity, which was encoded by the physical proximity between two dots. An example of the Semantic Treemaps is showed in Fig. 5.1.
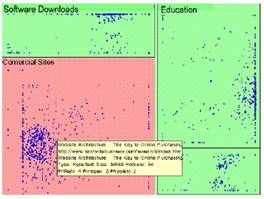
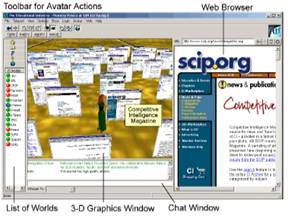
Fig. 5.1. A Semantic Treemap of Web links. Fig. 5.2. Interface to the Document Space.
Then they used a 3-D space metaphor to display these documents in the desktop interface, as showed in Fig. 5.2. In this 3-D space, each document is represented by a square panel textured by the corresponding web page’s thumbnail image and augmented by a short description such as the web page title, which appears when the user moves the mouse over the panel. As in other 3-D environment, users can walk through this space to probe documents of interest. Upon clicking the panel, the corresponding web page is displayed in the web browser interface. Users can collaboratively examine, discuss, and are able to modify (add and annotate) documents, thereby converting this document space into an ever-evolving repository of the user community’s collective knowledge that members can access, learn from, contribute to, and build upon.
They also conducted usability studies to determine the influence of panel size and panel density on retrieval performance. Results showed that subjects were faster and more accurate if web page panels are large and more dense, but not significantly so.
3.6. AquaBrowser
AquaBrowser is a fuzzy visualization tool that shows the high level description of a conceptual space, hiding irrelevant information and displaying information elements in context (Veling, 1997). It is a generic Java applet that can be embedded into any web page. Medialab, the developer of AquaBrowser claims that users of AquaBrowser can browse through a dynamic conceptual space, which is continually reshaped to reflect their interests. Animations make transitions from one state to another appear more fluid, showing users why and how the information is rearranged.
Medialab uses a term – “word cloud” as the visual metaphor of AquaBrowser interface. But in fact, the primary visual representation is a network of linked words, which are distributed in the conceptual space. The search term that the user assigns will display at the center of this network. The physical distance between another term node and this term encodes the relevancy between these terms. So the larger and nearer the words are to the center of the screen, the more relevant they are to the search term, and smaller and peripherally positioned if they are less relevant. Each of the user’s actions will change and rearrange the distribution and importance of the words, putting those of greater interest to the user in focus and those of less interest nearer the edge of the screen. It also uses colors encoding attributes of terms, such as spelling variations, visited words, translations, etc. Fig. 5 shows an example of a search display.
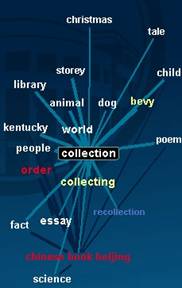
Fig. 5. A search display in AquaBrowser.
This tool has been used by quite a few libraries to enhance their online catalogue search interfaces. It could be a very useful search aid in digital libraries, too.
4. Summary
and Trends
The above examples illustrate some recent information visualization applications in a digital library environment. Many other metaphors and techniques such as perspective wall, cone tree, document lens and hyperbolic browser have been used or can potentially be used to facilitate user in searching, browsing and navigating through the rich information in a digital library.
The digital library is an interdisciplinary subject involving quite a few research areas such as information retrieval, multimedia information processing and classification. All these aspects of digital libraries make information visualizations more complicated in this environment. Therefore, most systems described earlier integrate various visualization techniques into other functions of digital libraries.
The above
examples, along with many others, show that 3-D space metaphor has gained great
attention from information science communities. The combination of 3-D space
and virtual reality that can be accessed from web browsers nowadays is becoming
a trend of information visualization in digital libraries. This technique gives
the user the maximum freedom to “walk” through the library collections,
searching and browsing documents. Meanwhile, many 2-D visualizations that
appeared in 1990s are still widely used. For example, both ActiveGraph and 3-D
Furthermore, it is very important to place additional emphasis on the need to consider users and usage. Research on any visualization in digital libraries should be based on a detailed analysis of users, their information needs, and their tasks (Bertini et al., 2002). Usability tests have been done for some of the above-mentioned applications whereas they were not mentioned in other examples. It is hard to say if a visual interface really facilitates the user’s perception of information without conducting appropriate usability tests.
References
Albert, C. and Shneiderman, B. (1994). Visual information
seeking using the FilmFinder. ACM CHI94 Conference.
Arms, W.Y. (1995). Key concepts in the architecture of the digital library. D-lib Magazine. URL: http://www.dlib.org/dlib/July95/07arms.html
Bederson, B.B. et al. (2002). Ordered and quantum treemaps: Making effective use of 2d space to display hierarchies. ACM Trans. Graph. 21,833-854
Bertini E. et al. (2002). Visualization in digital libraries. URL:
www.dis.uniroma1.it/~delos/docs/ivdls_book_chapter.pdf
Borner, K., Chen, C. (2002). Visual interfaces to digital
libraries: motivation, utilization, and socio-technical challenges. Visual
interfaces to digital libraries.
Borner, K. et al. (2000). LVis - digital library visualizer.
Information Visualization 2000, Symposium on Digital Libraries,
Borner, K. et al. (2002). Collaborative visual interfaces to
digital libraries. JCDL'02, July 13-17,
Card et al. (1999).
Chepesuik, R. (1997). The future is here:
Cruz-Neira, C. et al. (1993). Surround-screen projection-based virtual reality: The design and implementation of the CAVE. Computer Graphics (Proceedings of SIGGRAPH 93), Vol. 27, Springer Verlag, 135-142.
Doan, K.et al. (1996).
Query previews for networked information services. Advanced Digital
Libraries Conference.
Feng Y. & Borner K. (2002). Using semantic treemaps to
categorize and visualize bookmark files. Proceeding of SPIE - Visualization
and Data Analysis, 4665,
Fox, E. and Urs, S. (2002). Digital libraries. Annual Review of Information Science and Technology 36: 503-89.
Good, L.E. et al. (2005). A fluid Treemap interface for
personal digital libraries. JCDL’05, June 7–11,
Good, L.E. et al. (2004). Zoomable user interface for
in-depth reading. JCDL’04, June 7–11,
Graham, P.S. (1995a). Requirements for the digital research library. URL: http://www.ifla.org/documents/libraries/net/drc.htm
Hascoet, M. (1998). Using maps as a user interface to a
digital library. SIGIR’98,
Janssen, W.C., Popat, K. (2003). Uplib: a universal personal digital library system. ACM Symposium on Document Engineering, 234-242
Liu, Y. et al. (1998). Visualizing document classification:
a search aid for the digital library. Research and Advanced Technology for
Digital Libraries: Second European Conference, ECDL'98, Heraklion,
Lynch, CA. and Garcia-Molina, H. (1995). Interoperability, scaling, and the digital libraries research agenda: a report on the May 18-19, 1995 LITA Digital Libraries Workshop. URL: http://dbpubs.stanford.edu:8091/diglib/pub/reports/iita-dlw/main.html
Marks, L. et al. (2005). ActiveGraph: A digital library visualization tool. Int J Digit Libr 5, 57–69.
Rao,R. et al. (1996). Rich interaction in the digital library. Communications of ACM. 38(4), 29-39.
Shiaw H. et al. (2004). The 3D
Shneiderman, B., et al. (1999). Digital library search
results with categorical and hierarchical axes. DL-00: 5th ACM Digital
Library Conference.
Tufte, E.R. (1983). The visual display of quantitative
information. Graphics Press,
Veling, A. (1997) The AquaBrowser – visualization of dynamic concept spaces. Journal of AGSI 6(3), 136–142.
Zaphiris, P. et al. (2004). Exploring the user of information visualization for digital libraries. The New Review of Information Networking, 10(1), 51-69.